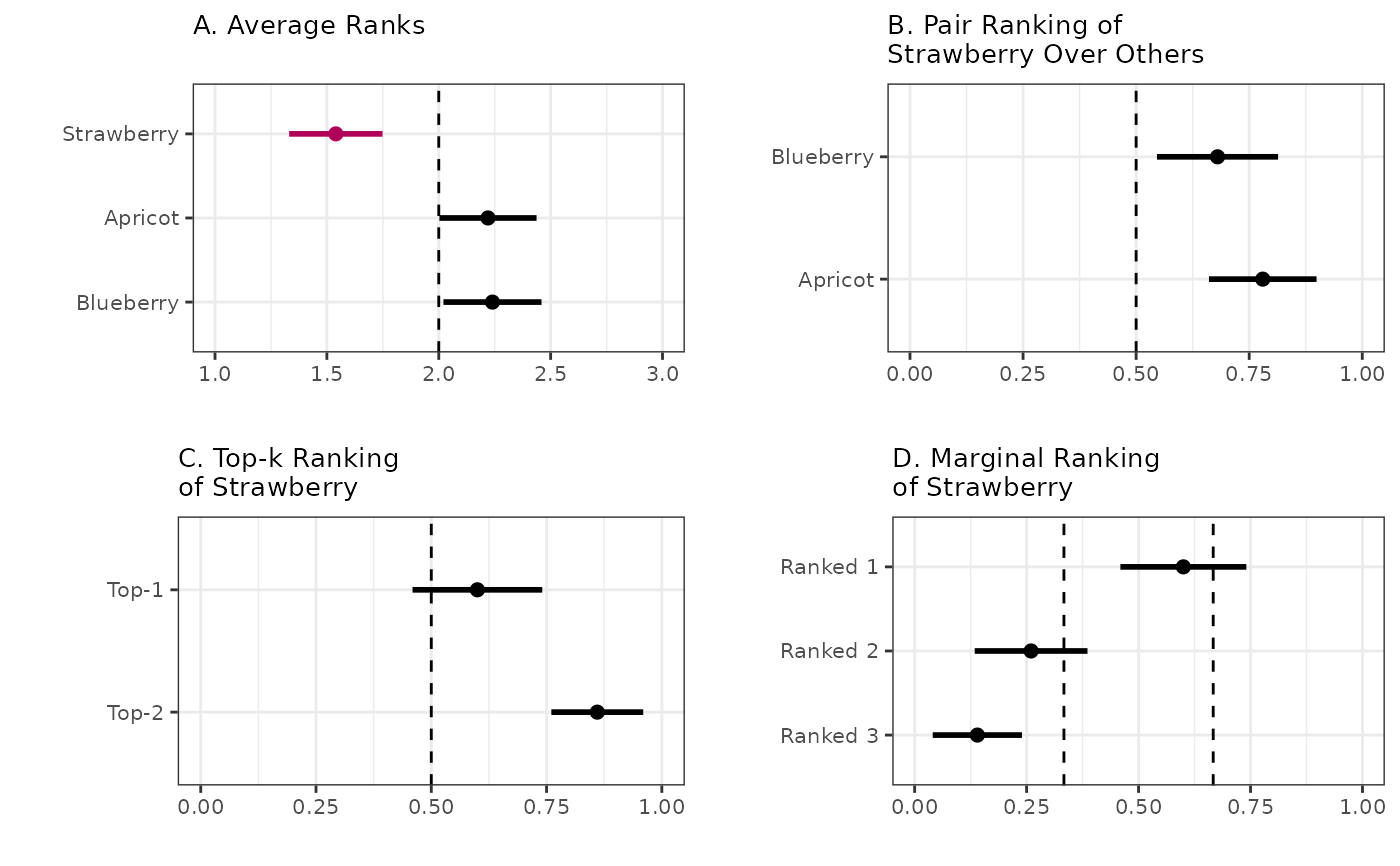
vis_ranking visualizes four quantities of interest from
ranking data: average rankings, pair rankings over a single target item over
other items, top-k ranking of the target item, and the marginal ranking of
the target item.
Arguments
- dat
The input dataset with ranking data.
- target_item
A string for the target item's variable name
- other_items
A set of strings for variable names corresponding to other items that were available as ranking options
- treat
The treatment indicator variable. Defaults to NULL.
- single_plot
If TRUE, returns a single plot. If FALSE, returns a list of plots that will compose the combined plot. Defaults to TRUE.
- weight
The weight vector to be used.
- color_palette
The color palette to be used.
- font
The font to be used. Defaults to NULL.
Value
A ggplot that visualizes all treatment effects. If single_plot is TRUE, it will return a single ggplot. If FALSE, it will return four ggplot objects in a list: average ranks, pairwise ranks, top-k ranks, and marginal ranks.
Examples
jam <- data.frame(
  strawberry = c(
    1, 1, 1, 2, 2, 2, 1, 2, 1, 2, 1, 1, 3, 1, 1, 2, 2, 1, 1, 1,
    2, 3, 1, 1, 2, 1, 2, 3, 1, 1, 1, 1, 1, 2, 1, 2, 1, 2, 1, 1, 1,
    1, 1, 3, 3, 1, 1, 3, 3, 1
  ),
  apricot = c(
    3, 3, 2, 3, 1, 3, 2, 1, 2, 3, 3, 2, 1, 2, 2, 3, 3, 3, 3, 2,
    3, 2, 3, 3, 3, 2, 3, 1, 2, 2, 3, 3, 2, 1, 3, 1, 2, 3, 2, 2, 3,
    2, 2, 1, 1, 2, 2, 1, 1, 3
  ),
  blueberry = c(
    2, 2, 3, 1, 3, 1, 3, 3, 3, 1, 2, 3, 2, 3, 3, 1, 1, 2, 2, 3,
    1, 1, 2, 2, 1, 3, 1, 2, 3, 3, 2, 2, 3, 3, 2, 3, 3, 1, 3, 3, 2,
    3, 3, 2, 2, 3, 3, 2, 2, 2
  )
)
viz_ranking(
  dat = jam,
  target_item = "strawberry",
  other_items = c("apricot", "blueberry")
)
